
Clarity That Drives Action
We design every dashboard around the decision it needs to support, so your team reads it once and understands what to do.
Sumedha Softech is a data analytics company that helps businesses stop guessing and start deciding with actual numbers. We handle everything from cleaning up messy data to building dashboards your team checks every morning. Fifteen years in software and AI, 700+ projects behind us, and one job here: make your data useful.
Tell us about your project — we will reply within one business day.
Trusted by founders and product teams worldwide
Most businesses collect enough data to make better decisions, but what they lack is a way to see it clearly. Our data analytics services combine sharp analysis with dashboards built for real understanding, so leaders, teams, and analysts work from the same numbers and move faster.
We design every dashboard around the decision it needs to support, so your team reads it once and understands what to do.
Sales, marketing, product, and finance data finally sit in one place, giving everyone the same version of the truth.
Our predictive analytics services study where things are heading, helping you act early instead of reacting after the fact.
From strategy to dashboards, we handle every part of the journey. Here’s how our data analytics and visualization services turn your raw numbers into decisions your team can act on.
Before we build anything, we sit down and figure out what decisions you're actually trying to make. We look at your data, your systems, your goals, then map out a plan so every dashboard has a real reason to exist.
Right now, your data's probably scattered across multiple different tools. We pull it all into one clean, connected warehouse, so your team stops hopping between platforms and starts working from numbers everyone agrees on.
We build the models and reports that give every department the same read on how the business is doing. Sales, finance, operations, all pulling from numbers they can actually use.
A spreadsheet full of numbers doesn't really tell you anything on its own. We design interactive dashboards in Power BI, Tableau, and Looker, shaped around your team and the decisions they need to make each day.
We take your historical data and build forecasting models that flag what's probably coming: a demand dip, a churn risk, a revenue spike. That's the difference between planning ahead and scrambling after the fact.
When your data outgrows what a normal spreadsheet can handle, or moves faster than your tools can keep up, we step in with pipelines built for that volume. Our big data analytics services find the insight that's actually in there.
We layer AI onto your analytics to catch what a human might scroll right past: odd patterns, anomalies, plain-language questions typed into a search bar. It's your analytics doing a bit more of the work.
If your dashboards feel outdated or a report takes three days to pull together, we rework the whole setup. Old systems move to modern platforms, and your stack gets rebuilt to keep pace with the business.
Book a free consultation, and we'll map the analytics and visuals that drive your decisions.
Where clear analytics and visualization deliver the biggest wins.
Real-time KPIs and insight for confident leadership.
Pipeline, attribution and ROI in one clear view.
Funnel, product and revenue analytics that lift conversion.
Real-time operational metrics and performance reporting.
Financial reporting and forecasting leaders can trust.
Usage, retention and cohort analytics for product teams.
Every industry generates data differently and asks different questions about it. Our data analytics services are shaped around what actually matters in your sector.
Book a Free CallWe help hospitals and clinics track patient outcomes, staffing, and resource use, turning scattered records into reports that support faster, safer care decisions.
Our data analytics consulting services help lenders and financial platforms monitor risk, catch fraud patterns early, and stay ahead of compliance reporting demands.
We build dashboards that track inventory, customer behavior, and campaign performance together, so pricing and stocking decisions are based on what's actually selling.
Fleet data, delivery times, and route performance come together in one view, helping operations teams spot delays and cut costs before they add up.
We turn project timelines, budgets, and site data into reports that help teams track progress and catch cost overruns before they become serious.
Our business intelligence services help platforms understand what audiences watch, read, or skip, turning engagement data into content and programming decisions worth making.
Good analytics doesn't happen in one big leap. It's a handful of stages we've refined over the years, each one setting up the next.
We start with questions, not dashboards. What decisions are you actually trying to make, and what's stopping you from making them with confidence right now?
Your data gets pulled out of whatever silo it's sitting in and connected into one clean, reliable source everyone can work from.
This is where we dig in properly, descriptive, diagnostic, predictive, whatever the question actually needs, not just whatever's easiest to build.
We design dashboards and reports around the person using them, so nobody has to hunt through fifteen tabs to find one number.
A great dashboard nobody understands is just a nice-looking spreadsheet. We train your team properly, so the analytics actually get used.
Data changes, your business changes, so we stay on to keep dashboards accurate and add new insights as your needs shift.
We don't lock you into one platform. We pick tools based on what your data actually needs, not what's trending.
The difference between pretty charts and real decision-making shows up in the details. Here's what you can count on.
Data engineering, BI and AI depth, with a 5.0 rating on Clutch.
We build the pipelines, not just the dashboards.
Dashboards built for clarity and adoption, not clutter.
We go beyond reporting to forecasting and AI insight.
Clean, validated, governed data behind every report.
Ongoing support so your analytics stay accurate as you grow.
A snapshot of the products our clients trust us to build and keep running.
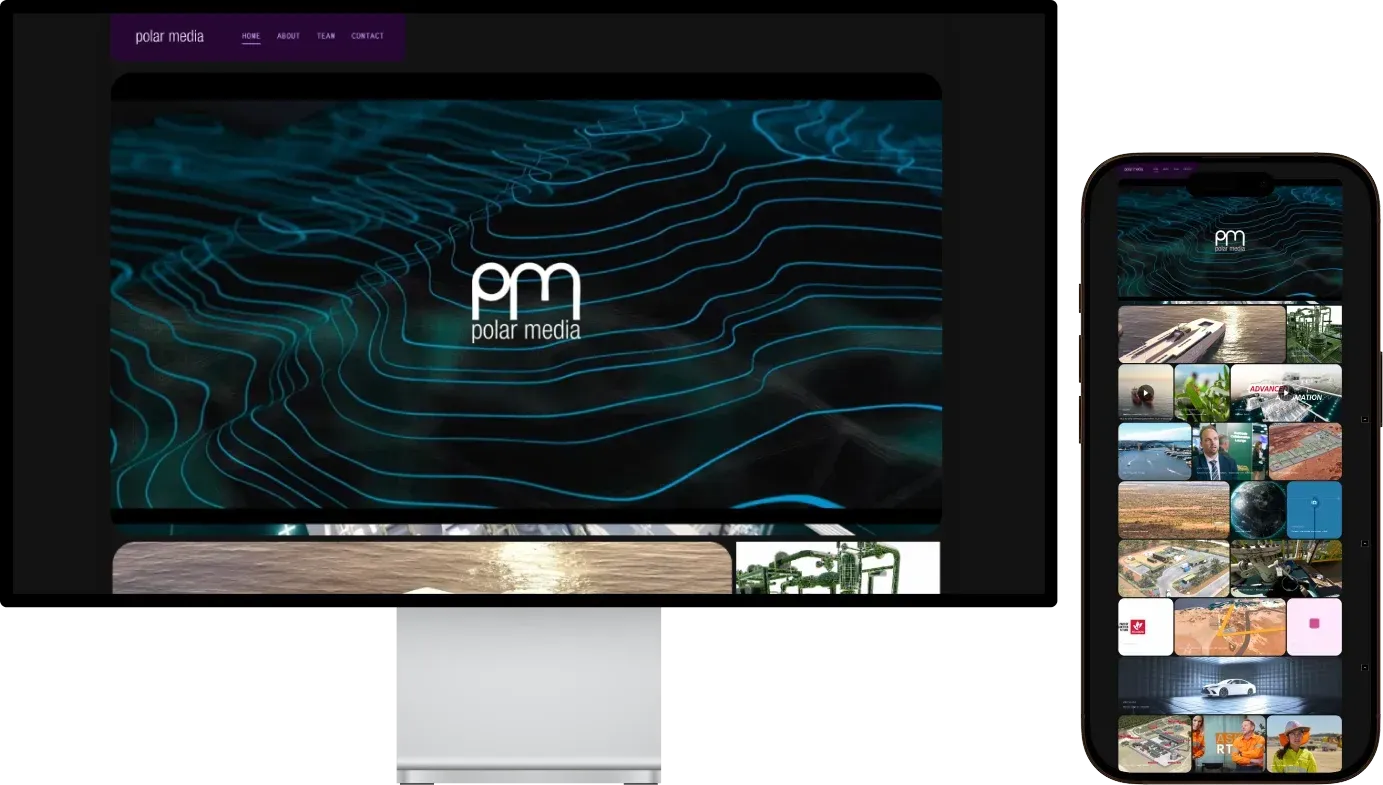
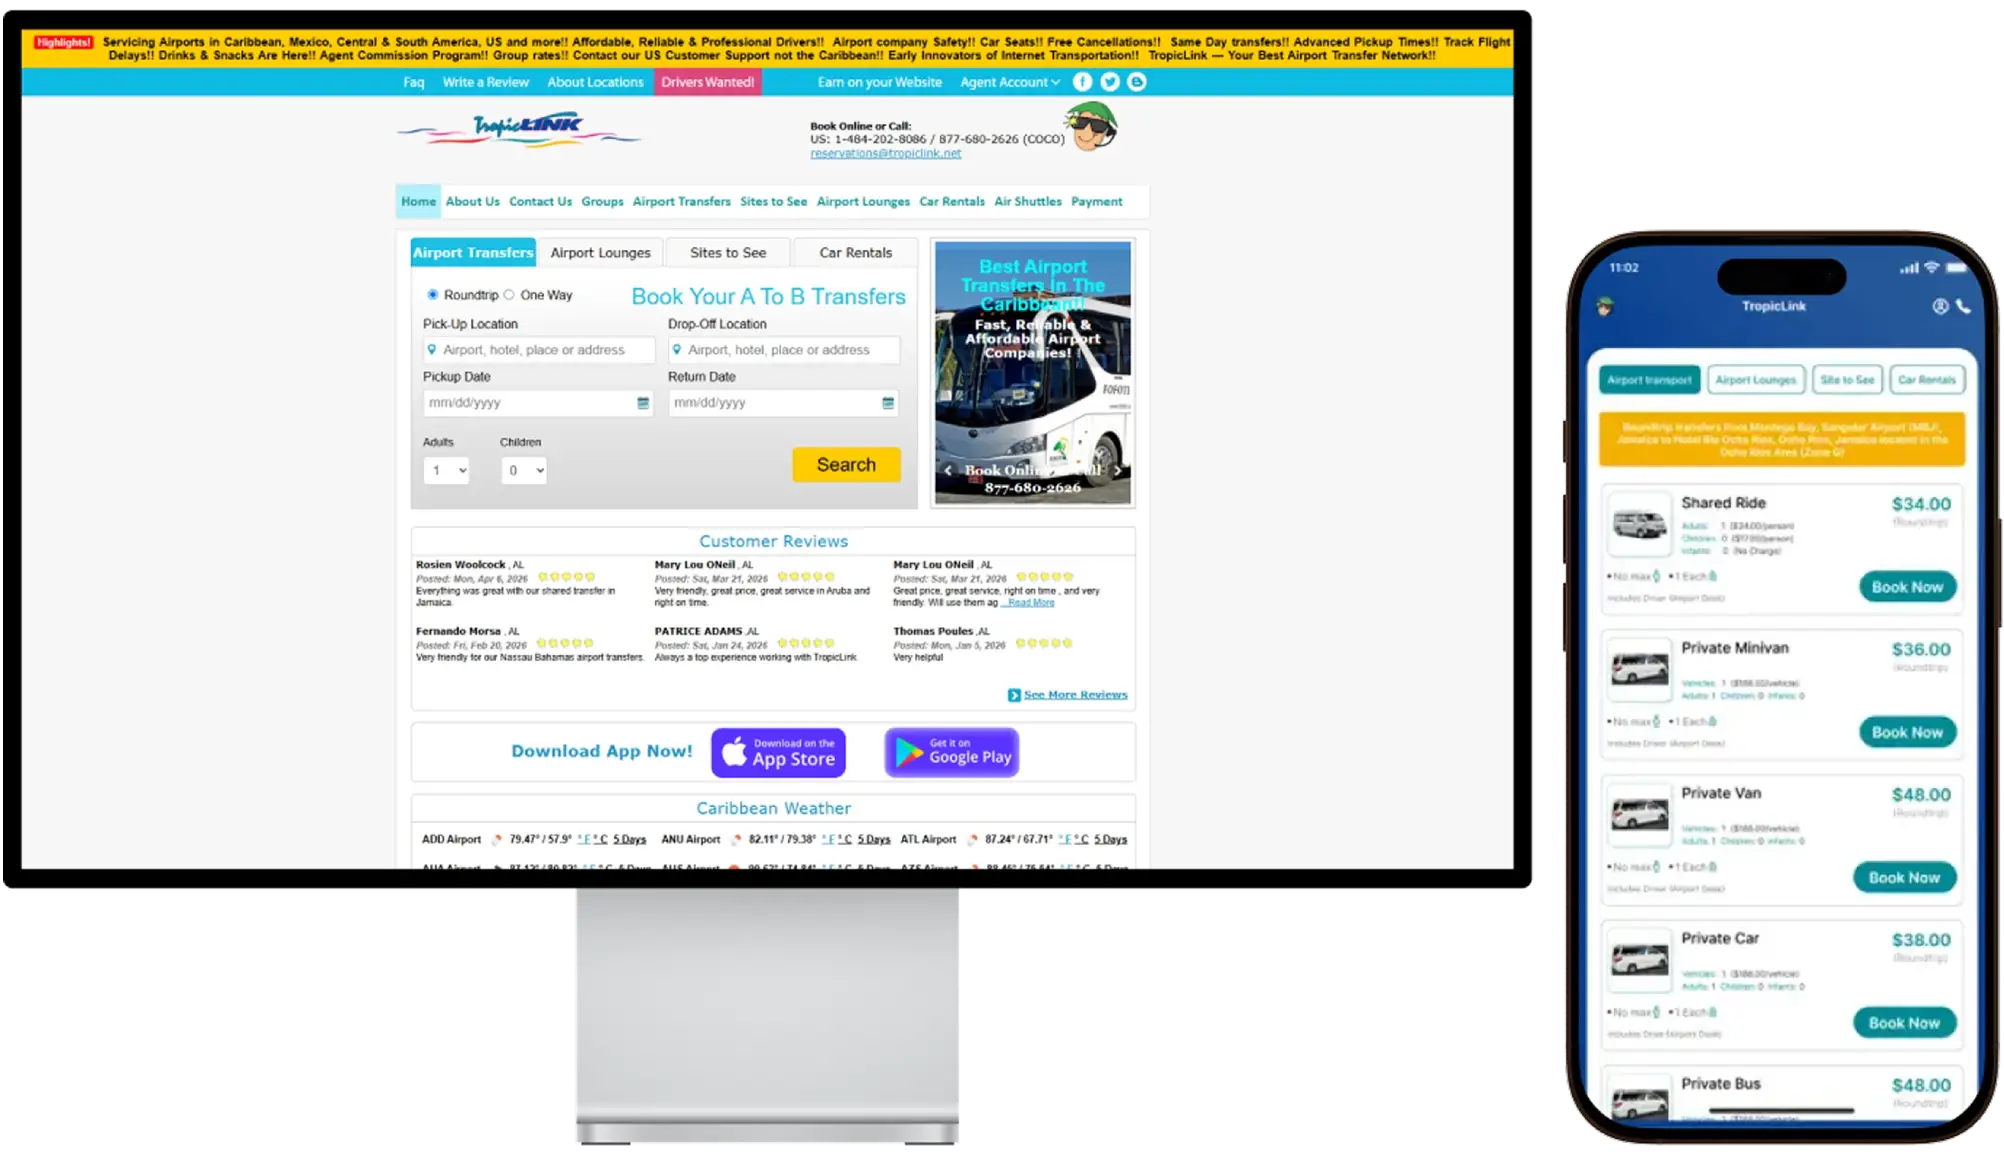
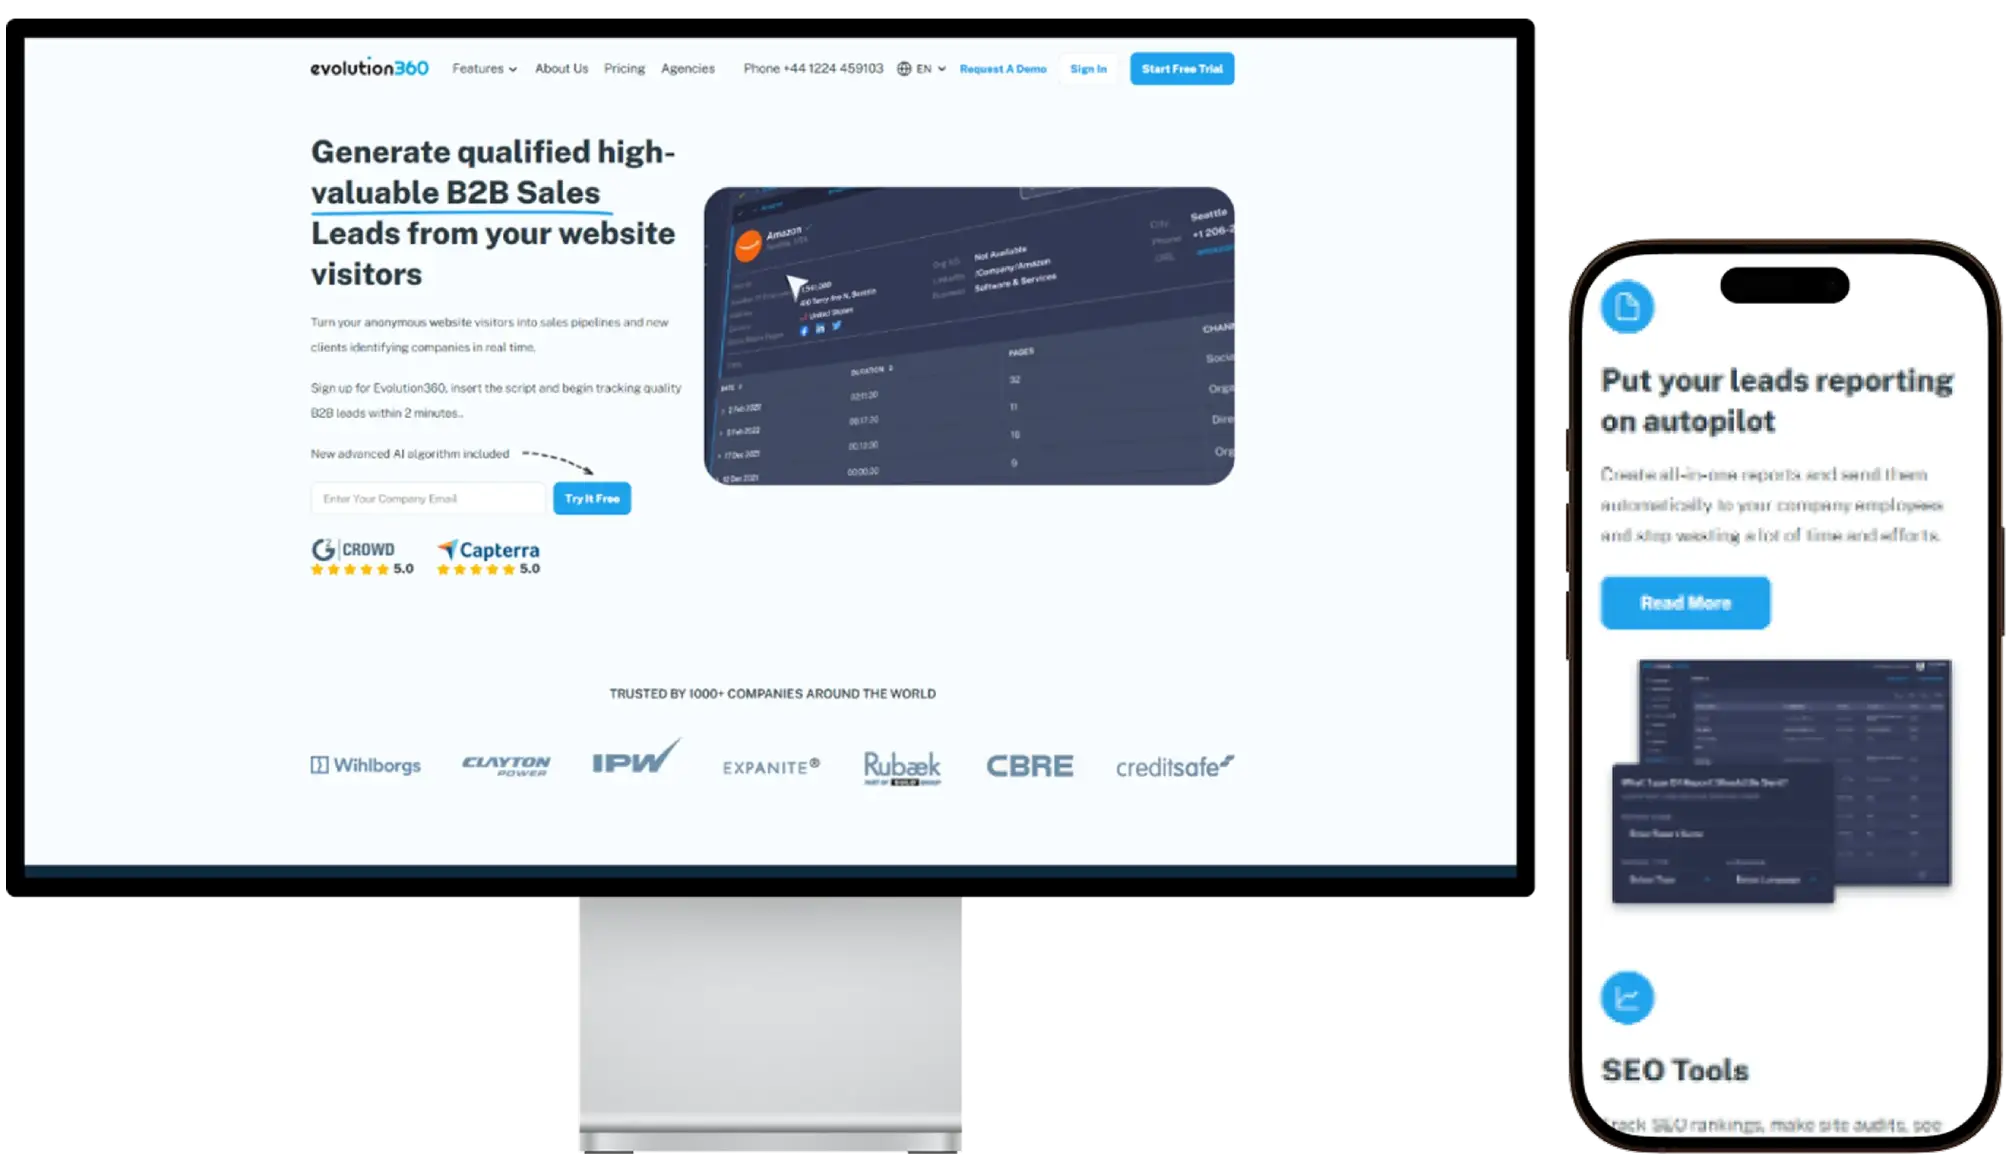
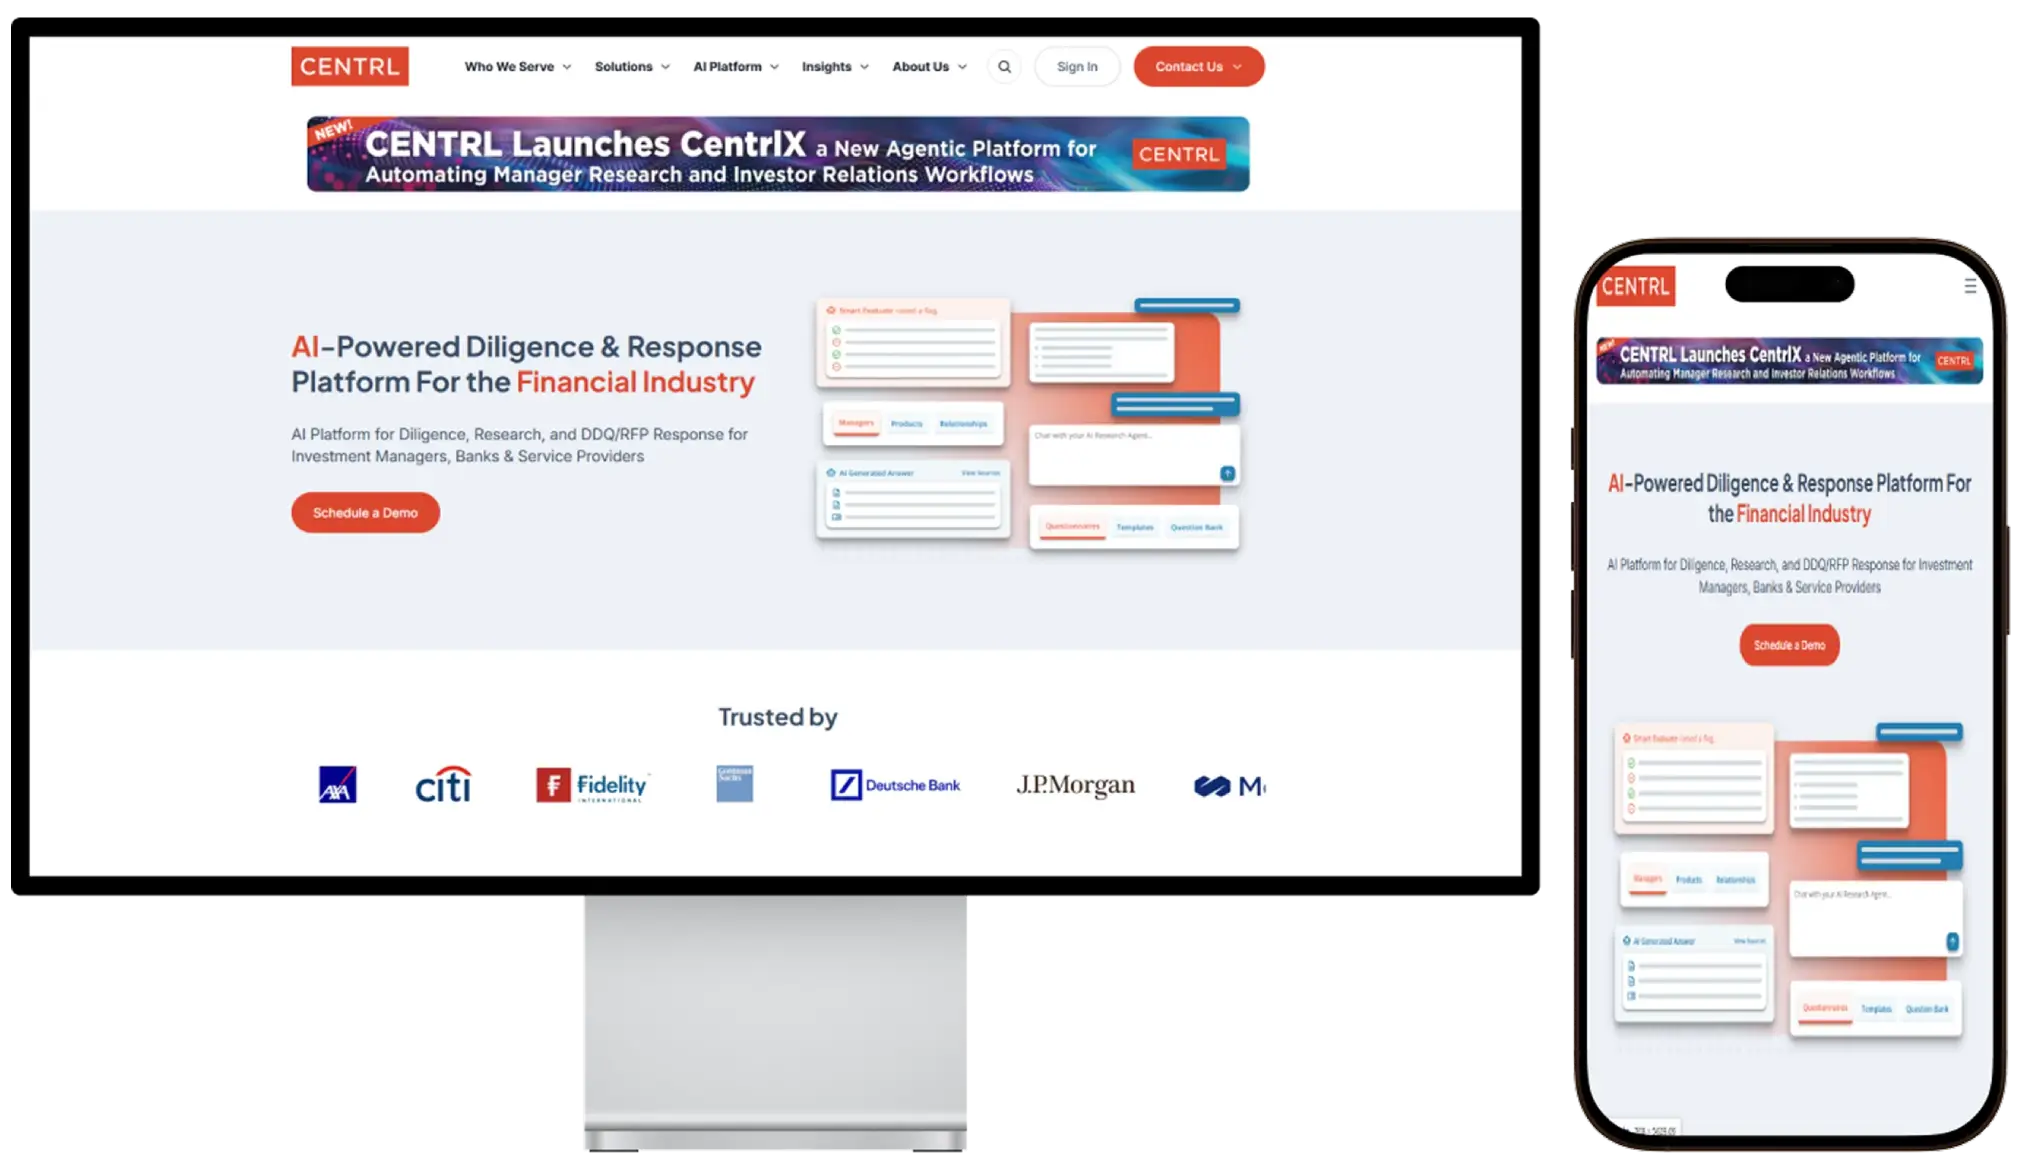
We measure success the way our clients do — by trust that turns into long-term partnerships.
"With Sumedha Softech, everything is possible. They turned a complex idea into a product that just works."
"They always find solutions to the problems we run into and are genuinely easy to work with. After three years, they feel like part of our own team."
"They support us with larger development tasks and ongoing fixes. Their level of technical expertise is genuinely very high."

Sumedha Softech Pvt Ltd delivered a website that the client could fully update and manage in-house. The team demonstrated solid project management and was responsive and easy to deal with. Sumedha Softech Pvt Ltd's patience and ability to work closely with the client set them apart.
The questions we hear most from teams planning analytics. Still curious? We're one message away.
Ask us anythingData analytics services help you make sense of your business data, cleaning it, analyzing it, and turning it into dashboards and reports your team can actually use to make decisions.
We build dashboards in Power BI, Tableau and Looker Studio, backed by data warehouses like Snowflake or BigQuery — choosing the right tools for your data, team and budget.
Analytics is the analysis that finds insight in your data; visualization presents that insight clearly through dashboards and charts. We do both — rigorous analytics paired with visuals designed for instant understanding.
Yes. Our predictive analytics services build forecasting and risk models, and our AI data analytics services add anomaly detection, natural-language querying and automated insight on top of your data.
Yes. We integrate web, marketing, product, sales and finance data into one governed source of truth, so every dashboard draws from clean, consistent data.
It depends on the number of sources, dashboards and depth of analytics you need. After a free consultation we send a clear proposal sized to your goals and budget.
Yes. If your current setup feels slow or outdated, we rebuild it on modern platforms so your reports run faster and your dashboards actually get used.
We keep your data secured with proper access controls and encryption, and we're happy to sign an NDA before any project details are shared.
Share a few details about your data and goals and we'll get back within one business day with ideas, a plan and an honest estimate. Free consultation, NDA on request.